


For most of the past three years, the case for Chinese equities rested on a single, simple idea: things were cheap, and cheap does not stay cheap forever.
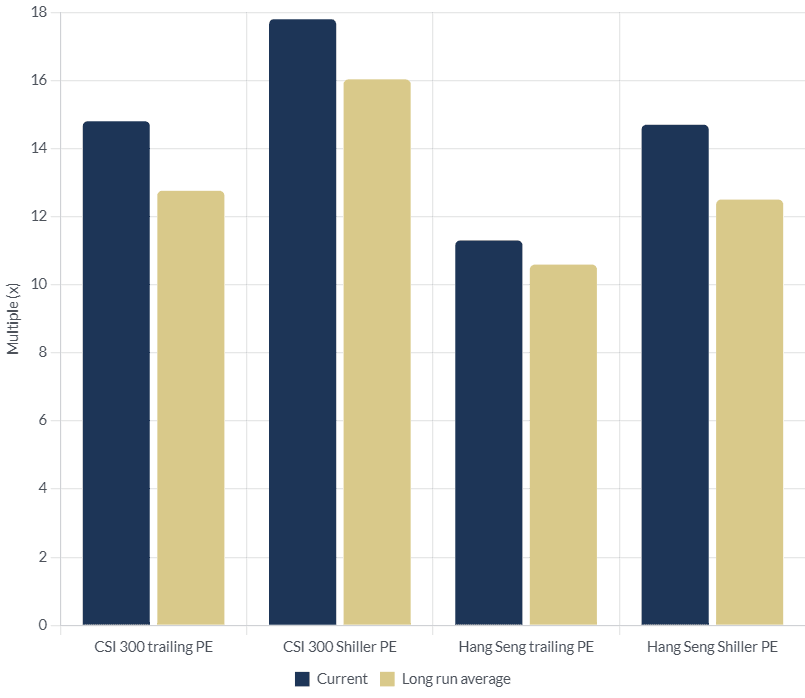
That case has done a lot of the work already. The CSI 300 now trades on a trailing price to earnings ratio of about 14.8, which sits roughly 16% above its own long run average of 12.76.
The Hang Seng, still the more battle tested gauge of sentiment toward Chinese assets, trades at 11.3 times trailing earnings against a long run average of 10.59, a premium of about 7%. Neither index is expensive by global standards. But neither is still the deep value trade it was in 2023 and 2024.
This matters for how the next stage of the China story should be framed. The rerating from trough multiples has already happened. The CSI 300 itself is now about 18% above its own long run average level in absolute index terms, not just on earnings multiples, having climbed from the low thousands to around 4,749 as of June 2026.
What investors are underwriting from here is less a reversion to fair value and more a bet on earnings delivery, policy follow through, and the durability of a slow, grinding bull market that Chinese fund managers themselves have started to describe in exactly those terms.
Table of contents
- The valuation picture
- Why the multiple moved
- Where the ecosystem sits: sector by sector
- Limits of this analysis
The valuation picture, properly measured
Cyclically adjusted measures tell a gentler story than headline multiples. The Shiller price to earnings ratio for the CSI 300, which smooths reported earnings over a rolling ten year window, stood at 17.8 as of June 2026 against a long run median of 17.1, a premium of only about 11%.
The Hang Seng's Shiller multiple was 14.7 against a median of 12.5. In both cases, the cyclically adjusted reading sits meaningfully below the all time highs the two markets have touched in past cycles, when the CSI 300 Shiller multiple reached above 100 during the 2007 bubble and the Hang Seng's touched 40.2.
Why the multiple moved
The proximate driver has been growth surprising to the upside against a backdrop of policy support.
China's economy expanded 5% year on year in the first quarter of 2026, beating expectations despite rising energy costs tied to the Iran conflict and continued softness in the property sector.
Goldman Sachs has raised its full year 2026 real GDP forecast to 4.8%, above both the Bloomberg consensus of roughly 4.5% and the International Monetary Fund's own estimate, citing resilient exports and a narrowing drag from the property downturn, whose contribution to GDP decline is expected to shrink from around two percentage points in 2024 and 2025 to a smaller figure this year.
Beijing's own targets have stayed conservative by design, with the 2026 Government Work Report setting a GDP growth band of 4.5 to 5%, alongside language explicitly ruling out a return to speed first, stimulus led growth.
The emphasis instead falls on what officials describe as high quality growth: anti involution reforms meant to squeeze out destructive price competition and lift corporate margins, a fiscal deficit target rising toward 4% of GDP, and an additional CNY 1 trillion in central government bond issuance front loaded to early 2026.
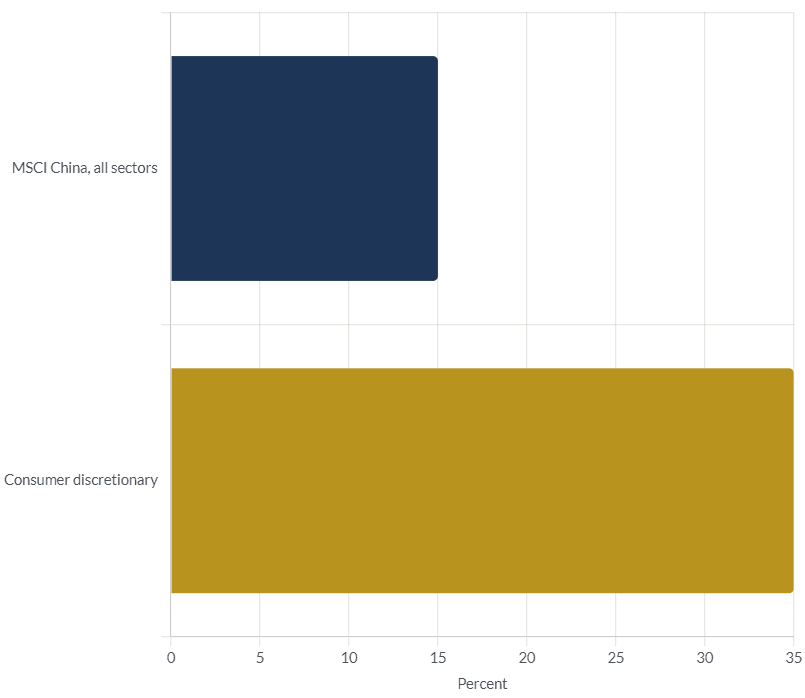
Consensus earnings growth for the MSCI China index in 2026 sits around 15%, with the consumer discretionary segment, led by internet and delivery platforms, expected to grow earnings by roughly 35%, according to Franklin Templeton's house forecasts.
Where the ecosystem sits: sector by sector
The mainland investment case in 2026 is no longer a single macro trade on reopening or stimulus. It has fragmented into distinct, investable pockets, each with its own driver.
Artificial intelligence and power equipment.
China's push toward domestic AI models, following the DeepSeek moment, is generating outsized demand for data centre capacity and grid infrastructure.
Monthly token usage across Chinese AI models is projected to run between 220 and 670 quadrillion tokens by 2030, compared with 100 to 175 quadrillion in the United States, according to Franklin Templeton estimates drawn from the major hyperscalers' own disclosures.
Local governments in Gansu, Guizhou, and Inner Mongolia have already cut power tariffs for data centres running domestically produced chips, a direct subsidy to the ecosystem around companies supplying grid and power equipment.
Semiconductors.
Export data for the first quarter of 2026 showed semiconductor exports rising 77.5% year on year in value terms, the fastest growing category in China's trade basket, ahead of vehicles and ships.
This reflects both genuine demand and Beijing's structural push for technology self reliance under the new fifteen year plan.
Consumer discretionary and internet platforms.
With the government's stated priority of raising the household consumption share of GDP and reducing the savings rate over the next five years, internet and delivery platforms such as Tencent and Meituan sit at the centre of the domestic demand thesis, alongside gaming and advertising recovery.
Healthcare and biotech.
China's share of global oncology clinical trials rose from 5% in 2014 to 39% in 2024, and international acceptance of Chinese clinical data has climbed following validated results published in peer reviewed journals, giving the sector a genuine export dimension beyond the domestic market.
Property, still the drag.
New housing starts remain about 75% below their peak and property investment roughly half of 2020 levels.
The sector's drag on headline GDP is expected to narrow from about two percentage points in 2024 and 2025 to something smaller in 2026, but UBS still expects a further 5 to 10% decline in property sales, starts, and investment this year.
This remains the clearest structural headwind against an otherwise improving cyclical picture.
Limits of this analysis
Valuation multiples referenced here are point in time snapshots as of May and June 2026 and will have moved by the time this is read; the direction of the premium to long run averages is the more durable signal than the precise decimal.
Earnings growth figures for 2026 are consensus estimates compiled by third party research houses, not realised outcomes, and China's history of forecast revisions, in both directions, has been unusually wide over the past five years.
Fund availability and subscription status for the Indian schemes named above change frequently and without much advance notice given SEBI's aggregate cap mechanism; readers should verify current subscription status directly with the fund house or a SEBI registered adviser before acting.
Nothing here constitutes investment advice or a recommendation to buy or sell any security or fund.

